Spatio-temporal data - Displaying time series, spatial and space-time data with R
Table of Contents
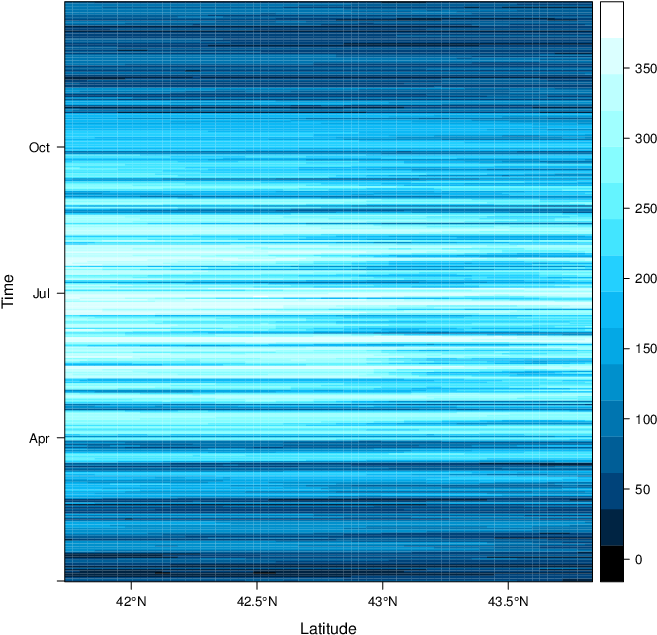
Raster data
The code of this section is available here.
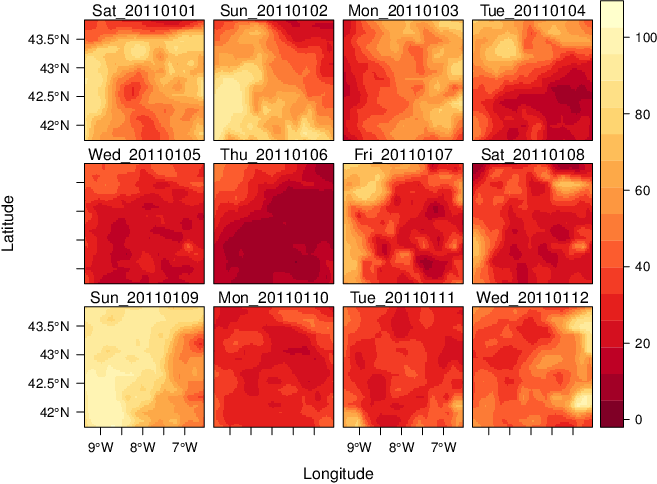
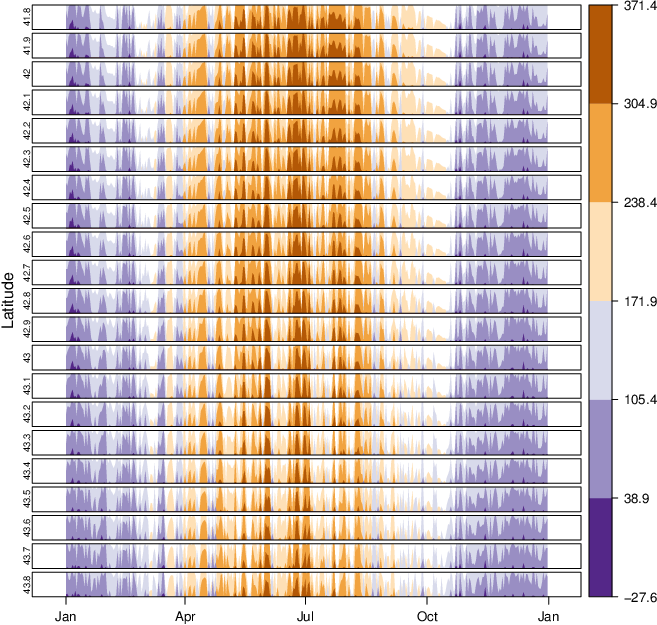
Level plots
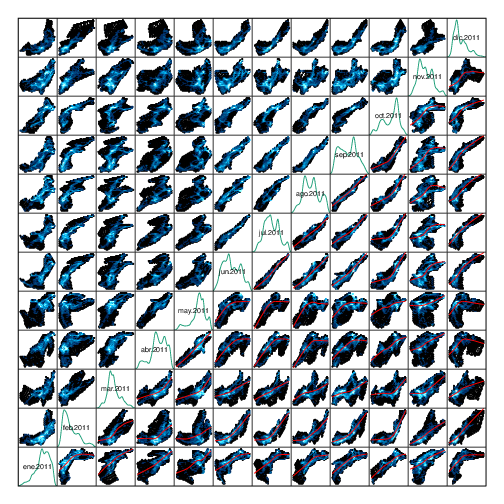
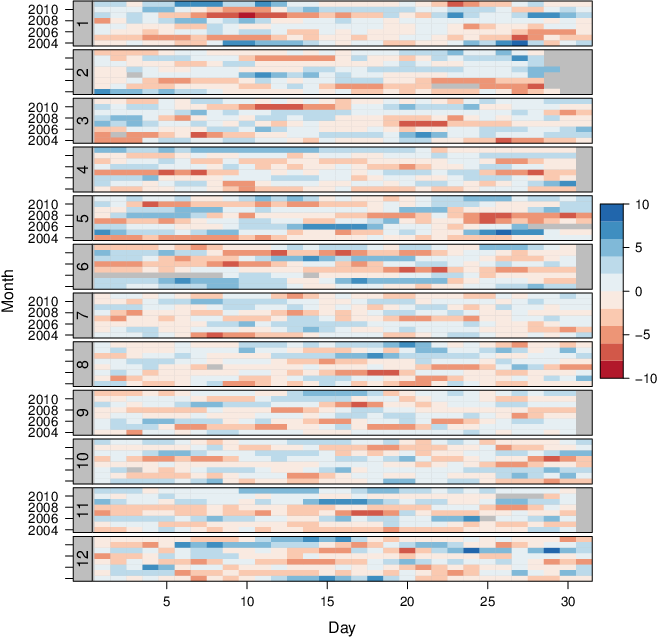
Graphical Exploratory Data Analysis
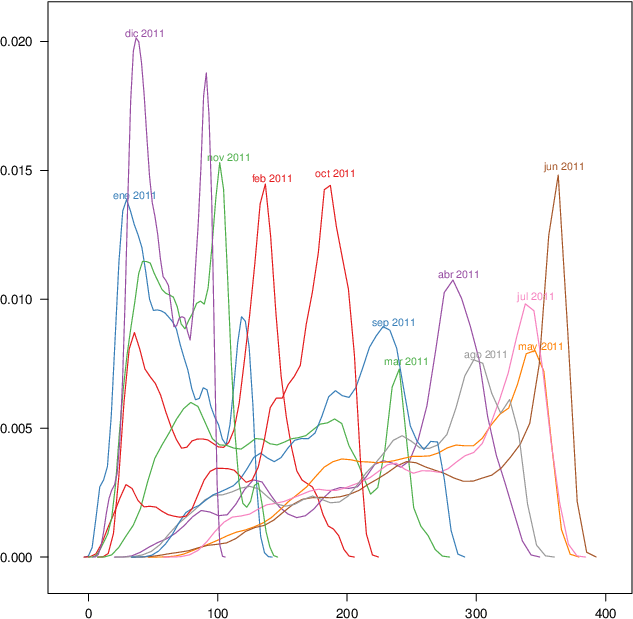

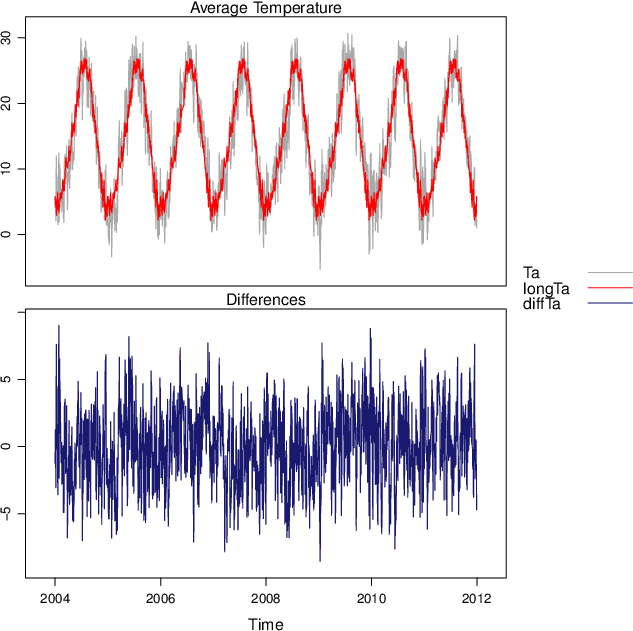
Space-Time and Time Series Plots
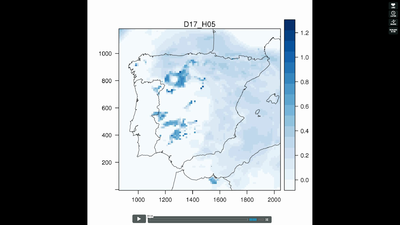
Animation