Time Series - Displaying time series, spatial and space-time data with R
Table of Contents
Time on the horizontal axis
The code of this section is available here.
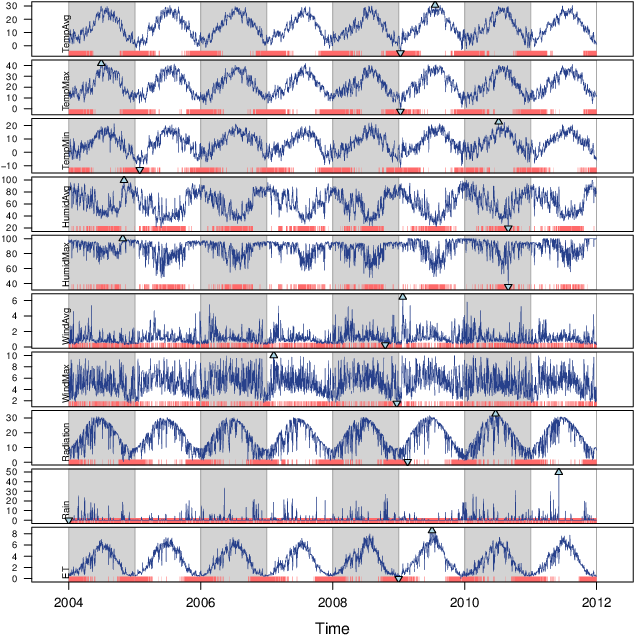
Time Graph of Different Meteorological Variables
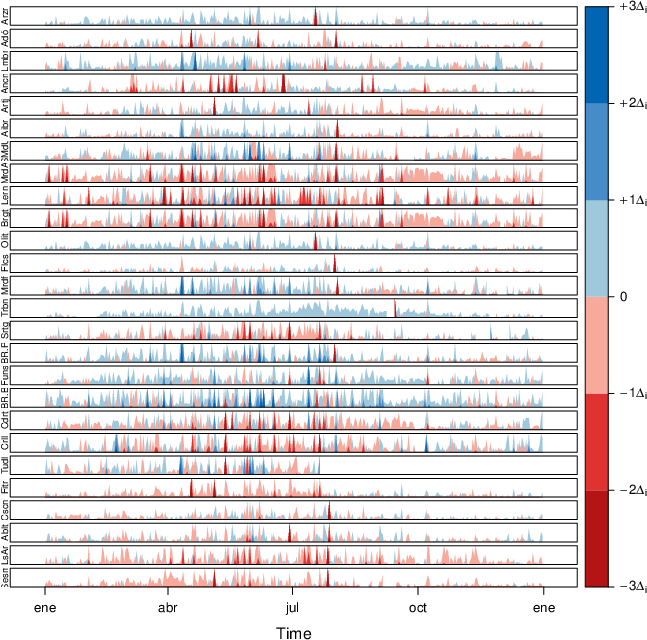
The Horizon Graph
Time Series of Variables with the Same Scale

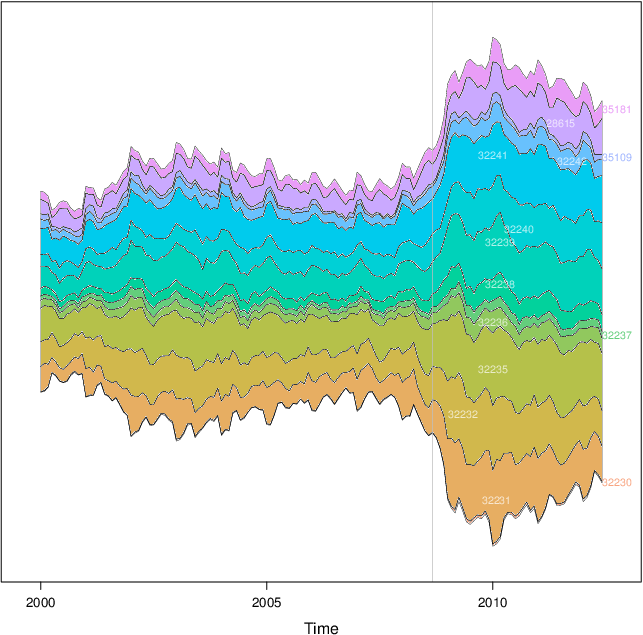
Stacked Graphs
Time as a conditioning or grouping variable
The code of this section is available here.
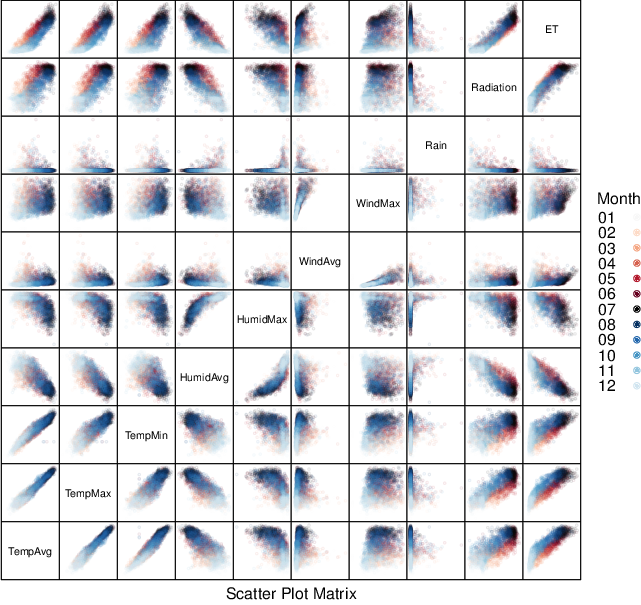
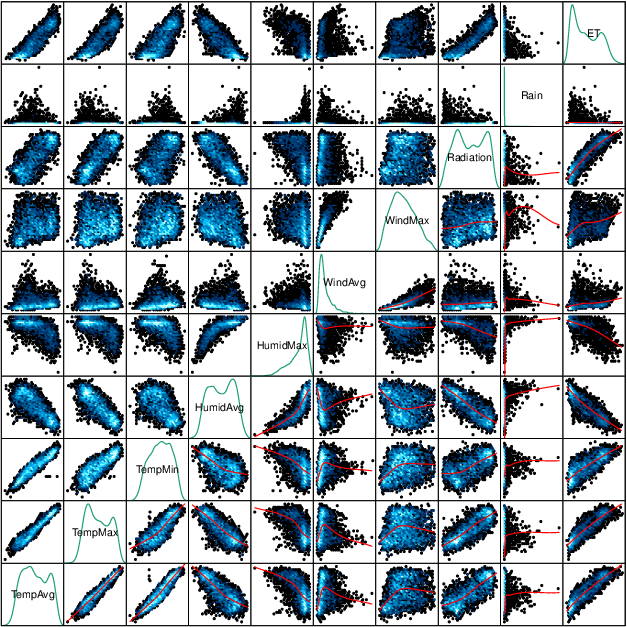
Scatterplot Matrix: Time as a Grouping Variable
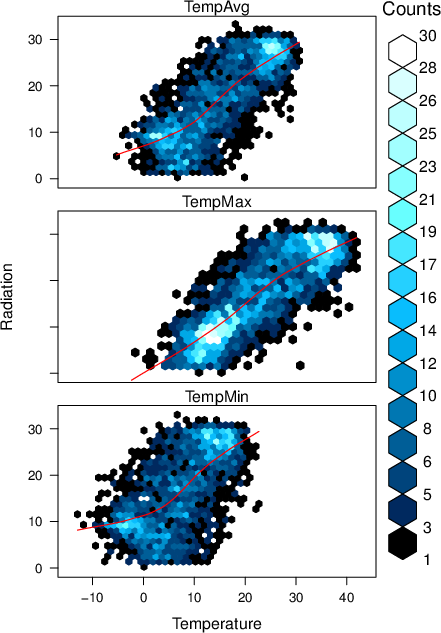
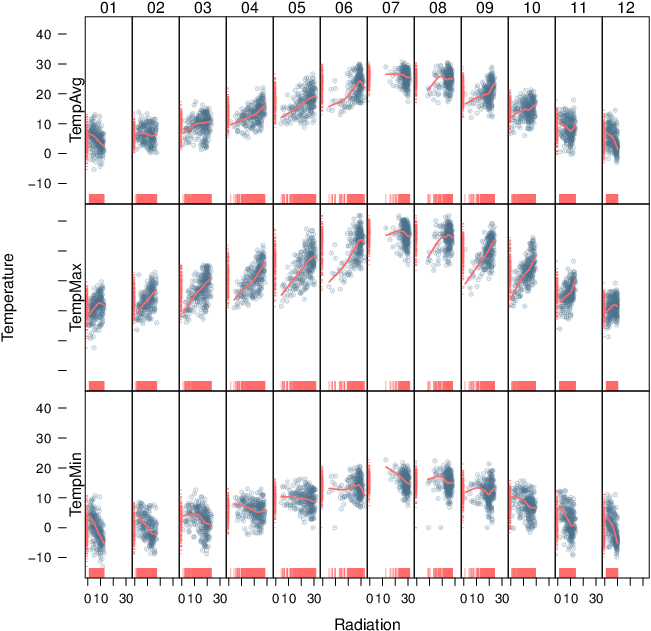
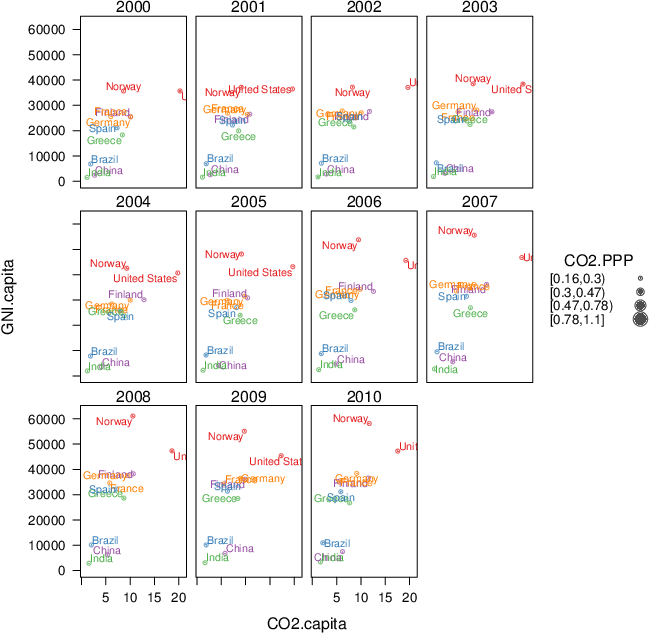
Scatterplot with Time as a Conditioning Variable
Time as a complementary variable
The code of this section is available here.
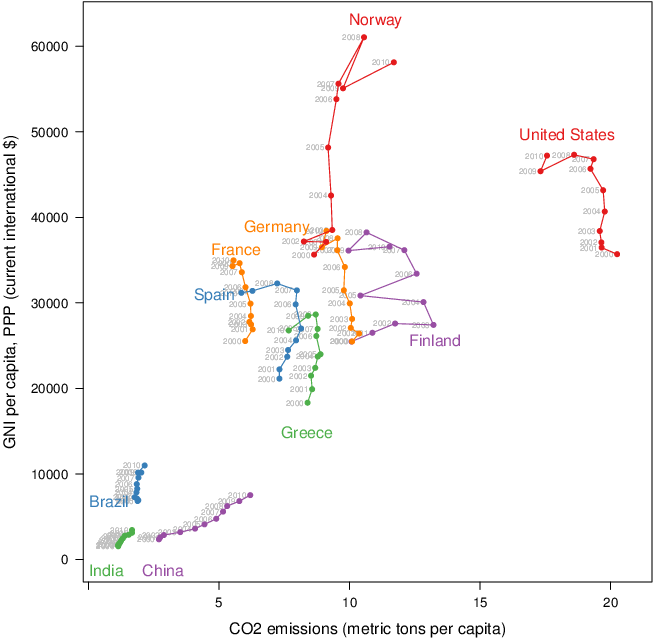
Polylines
Labels to Show Time Information
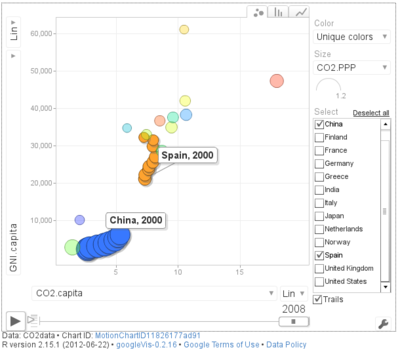
Using Variable Size to Encode an Additional Variable
Traveling Bubbles
