Displaying time series, spatial and space-time data with R
This is the accompanying website of the second edition of the book “Displaying time series, spatial and space-time data with R”, published with Chapman&Hall/CRC.
Code, data, and figures are available at this GitHub repository.
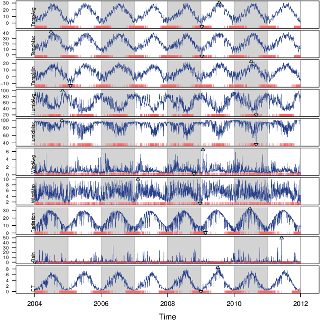
Time Series
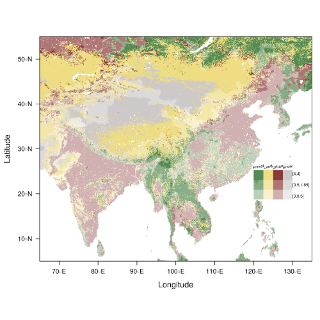
Spatial Data
Space-time Data
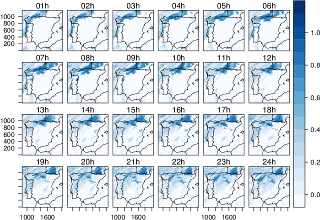
Focusing on the exploration of data with visual methods, Displaying Time Series, Spatial, and Space-Time Data with R presents methods and R code for producing high-quality graphics of time series, spatial, and space-time data. Practical examples using real-world datasets help you understand how to apply the methods and code. The book illustrates how to display a dataset starting with an easy and direct approach and progressively adding improvements that involve more complexity. Each of the book’s three parts is devoted to different types of data. In each part, the chapters are grouped according to the various visualization methods or data characteristics.
Along with the main graphics from the text, this website offers access to the datasets used in the examples as well as the full R code. This combination of freely available code and data enables you to practice with the methods and modify the code to suit your own needs.
This is a project created and maintained by Oscar Perpiñán Lamigueiro.